All days / World board / Close of Thursday, November 19, 2026Paper research. Every call is saved and graded. The decision is yours.

What is moving, and what to do about it

From the close of Friday, November 6, the latest on file: Headlines claim the week was driven by hopes of peace talks over the Iran war, then by the midterm election results hitting AI stocks; the evidence cannot prove either cause. Wednesday, November 4 brought oil -8.1%, and Thursday, November 5 brought the S&P fund -4.4% and tech/growth -6.3%. The fear gauge (the VIX, a measure of how nervous investors are) reads 25.6, still flagged as not calm.

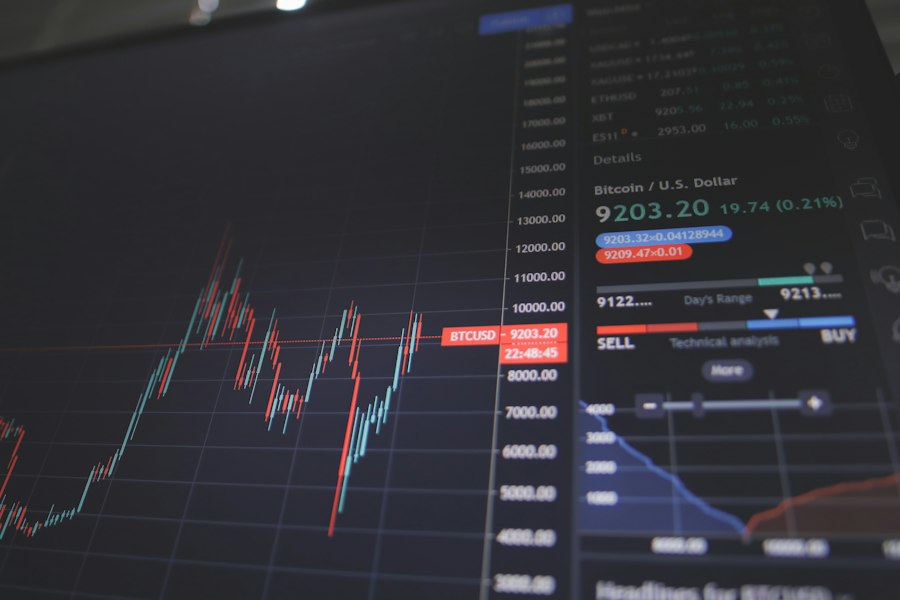
Market prices on a trading screen
BUY, NOT YETQQQ $645.04

Big tech after a one-day scare

Time window
About 3 months
Goes live when
Short-term fear drops back under long-term fear
Wrong if
The S&P fund closes under $727.65 five days in a row

WHY, FROM THE MODEL

The idea is that a sharp single-day fall in the market, while the market is still above its long-term average price (a rough gauge of the trend), is often fear inside an uptrend, and big tech tends to recover. The latest such fall was Thursday, November 5. In 7 past cases, QQQ (a fund that holds the biggest tech stocks) averaged +7.1% over the next 3 months, against +5.3% for an ordinary stretch, and it finished higher 86% of the time, against 76%. That looks good, but 7 cases is a very small sample, so luck could explain it. The market is 1.1% above its long-term average, so the condition is met, though not by much. The timing problem is that QQQ is 3.5% below its own long-term average and 12.7% below its recent high, so the tech fund itself has not held up. The headlines offer claims about the midterm election and AI worries as reasons for the fall, but they add no measured evidence, and the fear gauge (the VIX) reads 25.6, flagged as not calm.

Written for the close of Friday, November 6. The numbers beside it are current.

3 months later, this setup
+7.1%
Any 3 months
+5.2%

What supports it

  • Up 86% of the time after 3 months, against 75% normally

What argues against it

  • Only 7 past cases
  • QQQ is 5.4% under its 200-day average
  • Short-term fear is above long-term fear
  • QQQ is already 3.5% below its own long-term average, so the usual recovery may not follow this time.

Against your 3% bar: clears it on history, with few cases behind it.

Oil tanker at sea, seen from above
SHORT, WEAKUSO $138.09

Oil: the war fear coming out

Time window
About 3 months
Live now
Paper only, graded from here
Wrong if
Fighting flares again, or USO closes over $169.53, its high before this

WHY, FROM THE MODEL

The idea is that when war risk eases, the extra price paid for oil out of fear can drain away over months, so here the bet is that USO, a fund that tracks the price of oil, falls. The latest easing was Wednesday, November 4. In 25 past cases, USO averaged -0.7% over the next 3 months, against +4.1% for an ordinary stretch, and it finished higher 48% of the time, against 58%. That points the right way, but the average loss itself is smaller than the 3% bar the page uses, so the label is only weak. The timing problem is that USO is still 17.8% above its long-term average price, so the earlier rise has not unwound, even though it is already 12.5% below its recent high. The headlines mix peace talk hopes with reports of fresh ship attacks, and those are claims about why oil moves, not measured facts. The evidence does not say which side will win.

Written for the close of Friday, November 6. The numbers beside it are current.

3 months later, this setup
-0.2%
Any 3 months
+4.1%

What supports it

  • Up 50% of the time after 3 months, against 58% normally
  • 26 past cases

What argues against it

  • USO is 7.1% above its 200-day average
  • USO is already 18.5% off its recent high
  • The history is weak, and if the peace talks fail oil could climb again, which would hurt a bet that it falls.

Against your 3% bar: does not clear it. It stays on the board to be graded.

Inside tech

Tech is not one trade right now. Over 3 months the typical chip equipment stock moved -31.1%, and the typical technology distributors stock moved +22.7%. The question is which part fell for a real reason, and which part just got caught in the crowd.

Close-up of a computer chip on a circuit board

Best and worst parts, last 3 months

The typical S&P 500 stock in each part of tech.

Technology distributors+22.7%
Internet infrastructure+5.2%
Systems software+1.1%
Semiconductors-5.7%
IT consulting-6.4%
Electronic equipment-6.6%
Application software-13.3%
Communications equipment-15.8%
Electronics manufacturing-21.3%
Hardware and storage-21.9%
Electronic components-25.8%
Chip equipment-31.1%
FUND PAIR Buy IGV $96.10, short SOXX $137.95

Over the last 3 months IGV has held up better than SOXX. Historically the strongest tech funds kept beating the weakest by about 3.9 points over the next 3 months. Shorting the weak ones alone lost money, since even they rose 3.3% on average.

Wrong if: SOXX leads IGV over a full month. Against your 3% bar: just clears it, with 8 overlapping funds behind it.

No tech name on the buy list tonight.

SHORT LIST: MCHP $58.47, fell 10% on Nov 6, about flat since

Microchip fell 10.02% while its industry peers rose 2.76% at the median and the market was flat (SPY 0.31%), so this was about the company. Headlines say its December guidance was soft and disappointing, with supply problems and margin pressure, even though quarterly sales and earnings beat expectations. Several analysts cut their price targets afterward. It made money in most years shown, but net income was about zero in the year ended 2025-03-31 and only 0.23 billion dollars in the year ended 2026-03-31, well below earlier years. The agent is only at low confidence, so that is not enough for a short yet.

Wrong if: Supply problems easing and the next quarter's guidance coming in strong would suggest the fall was a scare rather than real damage.

The rule on this page: a falling price is never enough to short. Over 10 years the worst tech stocks still rose 6.2% on average in the next 3 months (today's index members, so a little flattering). A short needs a real damage reason, or a pair.

The buy and short lists are the agent's read of why a stock fell. That read is not proven yet: its first grades land in February 2027.

How every call gets made

1. The numbers come first

Code finds the setup and measures how it has played out before.

2. The model explains it

It reads those numbers and the news, then writes the why, including the case against.

3. A checker reads it

The model can only use numbers the code hands it. A second read throws out any claim the evidence does not back.

4. It gets graded

Every call is saved before the outcome and scored when its window ends, right or wrong.

4 calls on file. None has reached its first grade yet.